





Suppose a national inflation report says prices rose 3 percent over a year, and your own bills seem to say something else. Both can be true. The Bureau of Labor Statistics explains that individual experience can differ from a published average because of differences in weights and in prices, as described in its fact sheet on averages and individual experiences.
Here is one hypothetical household, with invented numbers, to show how that works. The figures are for arithmetic only. They are not CPI weights, not real price changes, and not guidance for anyone's finances.
What a price index averages
A consumer price index tracks the cost of a basket of goods and services. Each category in the basket gets a weight, which is its share of the total spending being measured. A category with a large weight moves the headline number more than a category with a small one.
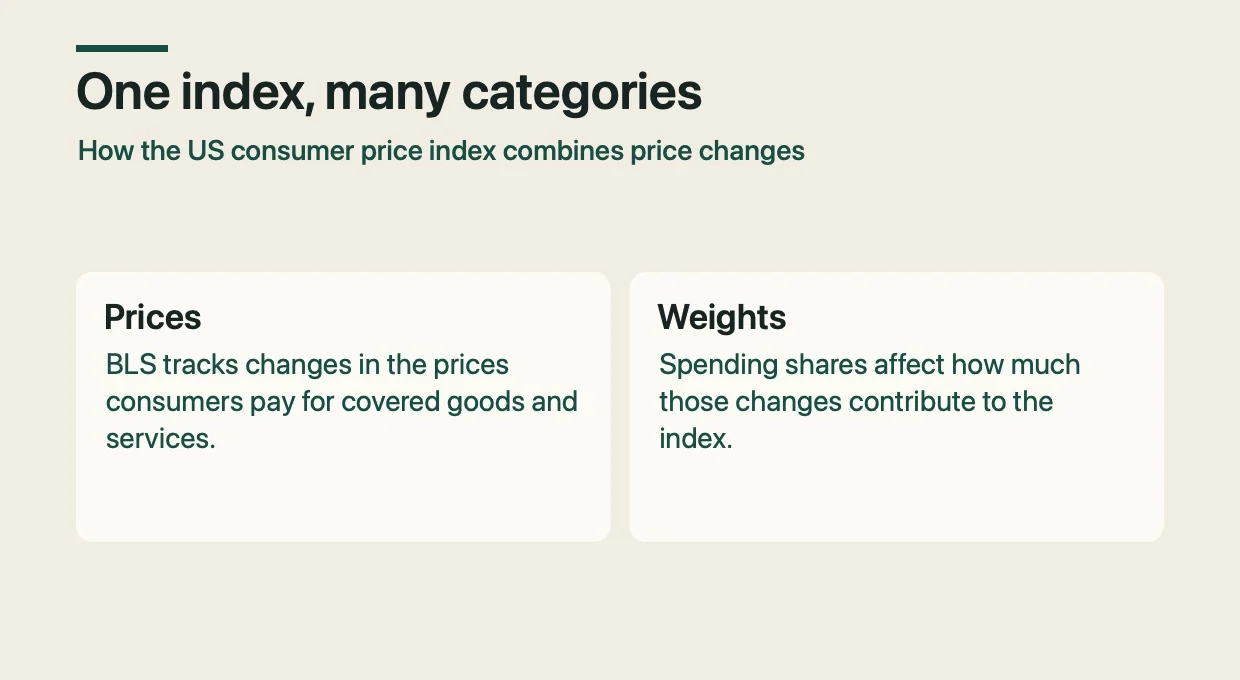
An average can sit between very different experiences. Think of a week's average temperature: it may match no actual day. The comparison stops working at one point. A price index is built from spending shares, so its average is a weighted blend, not a simple midpoint.
BLS describes the population and the measured baskets in its CPI questions and answers, including examples of how households differ. The index is built to represent a broad group, and that group's spending mix sets the weights. Any one household may spend quite differently.
Short version: the published number answers a question about the average basket. Your bills answer a question about your basket.
A hypothetical household, with the arithmetic
Start with a made-up reference basket of four categories. Housing is 40 percent of spending, food is 20 percent, transportation is 20 percent, and everything else is 20 percent. Now assume, again hypothetically, that over one year housing prices rise 2 percent, food prices rise 4 percent, transportation prices rise 6 percent, and everything else rises 1 percent.
Multiply each weight by its price change and add the results. Housing contributes 0.4 times 2, or 0.8 points. Food contributes 0.2 times 4, or 0.8 points. Transportation contributes 0.2 times 6, or 1.2 points. Everything else contributes 0.2 times 1, or 0.2 points. The total is 3.0 percent. That is the reference basket's inflation rate in this example.
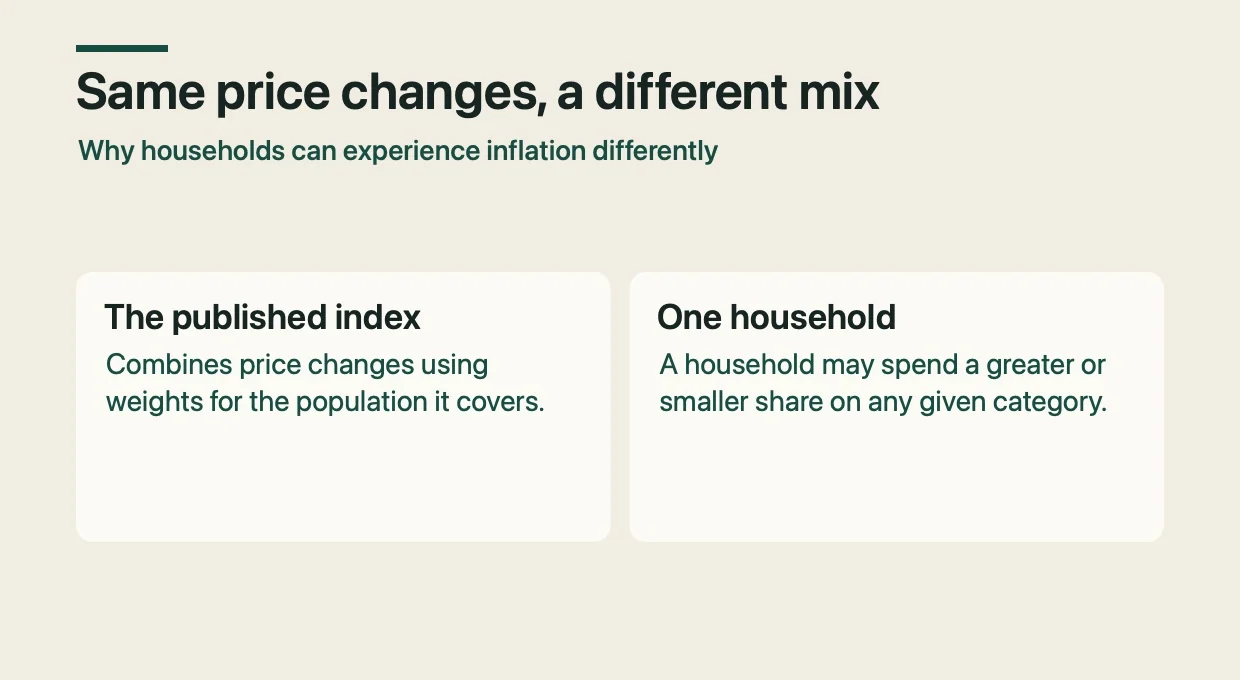
Now take a hypothetical household that spends 30 percent on housing, 30 percent on food, 30 percent on transportation, and 10 percent on everything else. The price changes are the same. Housing contributes 0.6 points, food 1.2, transportation 1.8, and everything else 0.1. The total is 3.7 percent. Nothing about prices changed. Only the mix did.
A third hypothetical household spends 55 percent on housing, 15 percent on food, 10 percent on transportation, and 20 percent on everything else. Its contributions are 1.1, 0.6, 0.6, and 0.2 points, for a total of 2.5 percent. Same prices, and a rate 1.2 points lower than the second household's.
Turning percentages into dollars
Percentages can hide how large the change is in a monthly budget. Assume the second household spends $4,000 a month in total: $1,200 on housing, $1,200 on food, $1,200 on transportation, and $400 on everything else. The same price changes add $24 to housing, $48 to food, $72 to transportation, and $4 to everything else. The monthly increase is $148, which is 3.7 percent of $4,000.
The reference basket's 3.0 percent would have implied $120 on the same $4,000. The gap is $28 a month in this example. Whether $28 matters depends on everything else going on in a household, which a single average does not capture.
When prices differ, not just weights
Weights are only half of the BLS explanation. Prices are the other half. The fact sheet attributes differences to both, so two households with identical spending shares can still see different inflation if the things they buy change price by different amounts.
The same price change matters differently depending on the share it hits. A 5 percent rise in a category that is 10 percent of spending adds 0.5 points. The same rise in a category that is 55 percent of spending adds 2.75 points. Size of the change and size of the share work together.
Extend the third household. Suppose, hypothetically, that its housing costs rise 5 percent instead of 2 percent. Housing now contributes 0.55 times 5, or 2.75 points. Add 0.6, 0.6, and 0.2, and the total is 4.15 percent, above the reference 3.0 percent. The household that ran below the reference rate now runs above it.
Notice what the example does and does not show. It shows that a different mix, or different price changes within the same mix, moves a personal rate away from the average. It does not show that any real household's inflation is higher or lower than a published figure. That takes that household's own spending and prices.
Where this explanation breaks down
The arithmetic above holds spending shares fixed for the year. A real household may change what it buys as prices move, and a fixed-share calculation would not capture that. The example is a teaching device, not a measurement.
Irregular income complicates the picture further. A household whose monthly spending swings widely does not have one stable set of shares, so any single percentage describes only one period. For that household, the dollar change month by month can say more than a rate.
A practical objection: you may not want to build a weighted spreadsheet, and the time may not be worth it. That is fair. The point is not to compute a personal rate to the decimal. It is to read a headline number with the right question attached.
What you can decide with this
If you want to test the idea, list your three largest spending categories and compare how each changed over the same period, using your own statements. That is a way to read a headline, not a recommendation about what to do with a budget. It costs a few minutes and no software.
That check is unsuitable when income or spending is swinging, or when a move or a major purchase is changing the mix. In those cases the fixed shares in the example do not hold, and a single percentage of either kind, national or personal, says little.
The national figure describes what happened to an average basket. Your own bills describe what happened to yours. The decision open to you is which of those two questions you are trying to settle with the money you have.