Why the label changes the dollar figure
Take a hypothetical $10,000 held for one year at a stated 4.00% rate, with interest paid twice a year. Each payment is $200. If the first $200 is reinvested for the second half of the year at 2.00% per half-year, it earns $4, so total interest is $404 instead of $400. The $4 difference comes from compounding, which means interest earning interest. These numbers are invented for arithmetic only and describe no actual return.
That small gap shows why the label on a five-year rate matters. No observed price enters the arithmetic. The one calculation that counts is the conversion between conventions. The U.S. Treasury describes its constant maturity yields as bond-equivalent yields, which express semiannual interest on a simple annual basis. An annual percentage yield, or APY, includes compounding. Two figures that both read about 4 percent can therefore rest on different footings.
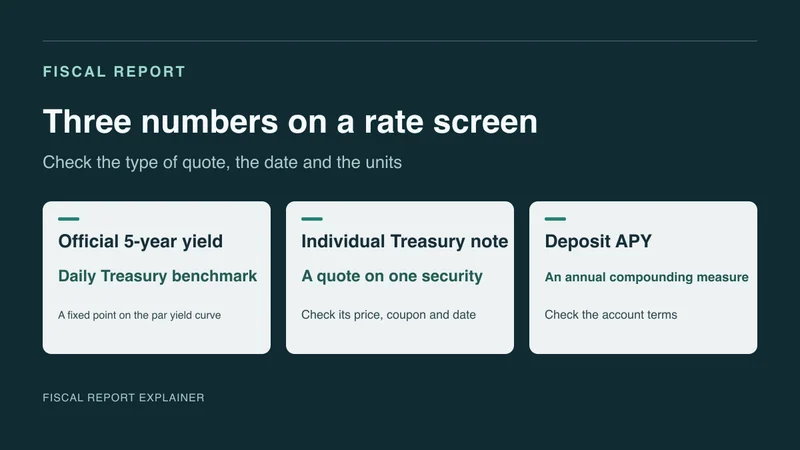
Sort any five-year figure by its label. A value read from a stated date and the 5 Yr column of Treasury's daily par yield table is the benchmark, meaning a calculated reference figure read from a curve rather than the yield of one traded bond. A value tied to a named note and a time is a quote for that note. A value labeled APY is a deposit-style rate that includes compounding. None of the three is an actual return.
What the Treasury benchmark measures
Treasury publishes constant maturity rates, often shortened to CMT rates. Each is a fixed-maturity point read from the daily par curve. Treasury describes a daily constant maturity rate as the par yield for a new theoretical Treasury security with that maturity on that date. The 5 Yr column of the daily table is where the five-year point is read. The figure is therefore a reading at a five-year horizon, taken from a curve rather than from one bond. It may not match the yield of a particular security.
The curve is constructed from indicative closing bid market prices on Treasury securities. Treasury also states that a CMT rate may not match the yield of a specific security, and its interest rates frequently asked questions page is the place to read these descriptions in full. That statement is the main limit on how the figure can be used.
A familiar comparison is a regional weather reading versus the thermometer at one address: two readings of the same day that need not agree. The comparison stops at curve construction. The weather analogy does not explain how closing bid prices become a par curve, so the benchmark should not be read as a simple average of anything. The short version is this: closing bid prices go in, a par curve comes out, and a fixed-maturity point is read from it.
Why a quote for one note can differ
Suppose a hypothetical table entry reads 4.00% at the five-year tenor for a given date, and a hypothetical screen shows 4.06% for one note. The gap is 0.06 percentage point, or six basis points, where a basis point is one hundredth of a percentage point. The subtraction is easy. The explanation is not.
There are places to look first, offered as cautions and not as a Treasury finding. One is timing. The daily table rests on closing bid prices, so a screen quote belongs next to it only after the time and date label on each figure has been compared. Another is the security. A quote describes one note, while the table reads a point on a curve, and Treasury says a CMT rate may not match a specific security. A third question stays open: whether the screen states yield on the same bond-equivalent basis as the table. Any of these, or several together, could produce a gap.
A tidy causal story is tempting here. It is easy to say the market moved between the close and the screen reading. That may be true, but nothing establishes it, and the six basis points cannot be split into parts from two invented figures, so how much each possible explanation would contribute is unknown.
Why an APY and a bond-equivalent yield differ
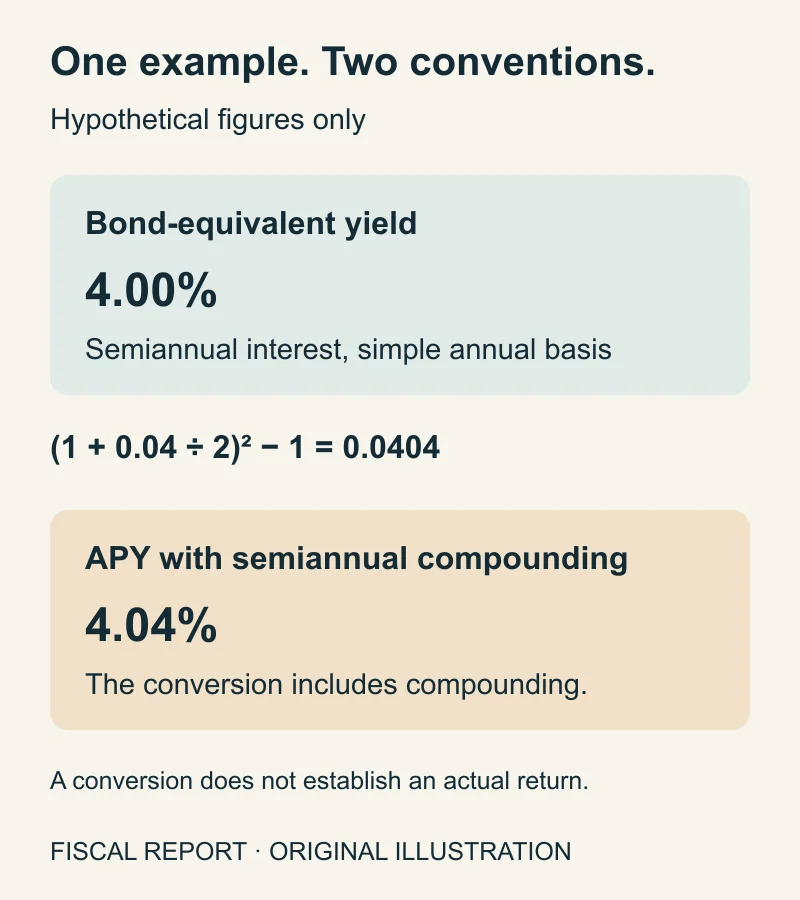
Treasury's CMT yields are bond-equivalent yields. Semiannual interest is expressed on a simple annual basis, so two hypothetical half-year payments of 2.00% each are written as 4.00%. An APY includes compounding, so the same two payments appear as a slightly higher annual figure.
Treasury gives the conversion. In decimal form, APY equals one plus half the bond-equivalent yield, all squared, then minus one. For a hypothetical yield of 0.04, half is 0.02, one plus that is 1.02, and 1.02 squared is 1.0404. Subtracting one leaves 0.0404, or 4.04%. The 0.04 percentage point difference is mechanical. It does not mean anyone earned 4.04%.
The conversion puts two figures on the same compounding footing. It assumes semiannual interest, which fits the Treasury side. The CFPB's Regulation DD appendix A describes the annualized deposit APY as based on the interest amount and the frequency of compounding, and it gives CD examples. The conversion does not make a Treasury and a CD alike in fees, penalties or account terms, and it shows nothing about how any particular CD compounds or whether a rate is guaranteed. A reader holding a CD offer should read that institution's own disclosure. None of this says which choice would suit anyone.
How to reproduce the lookup
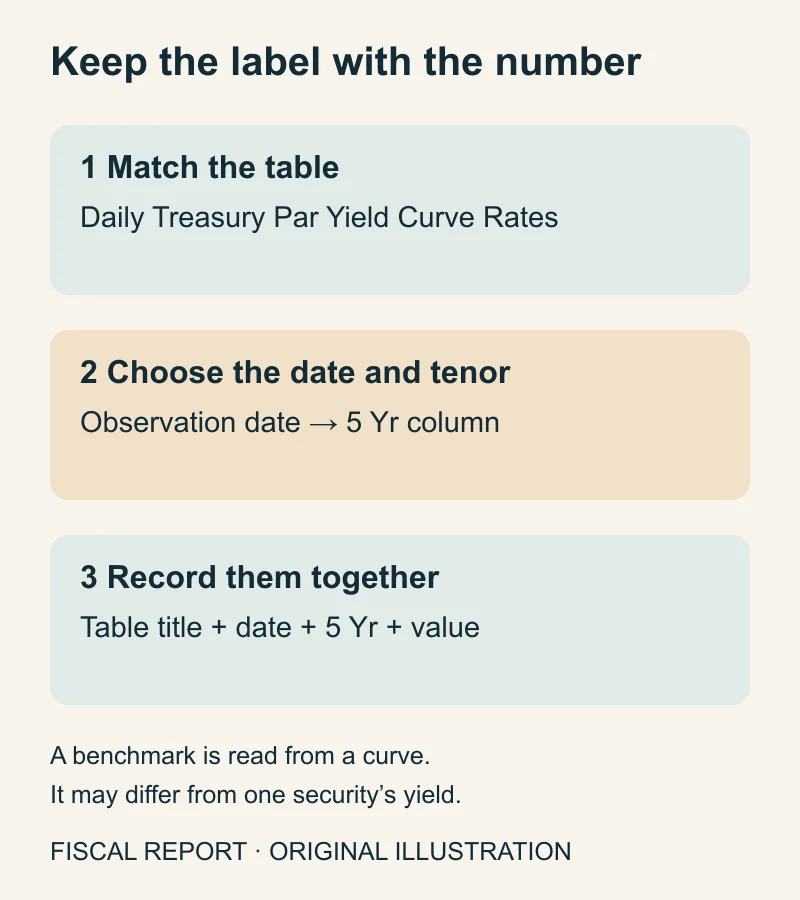
A reproducible lookup needs two inputs, one date and one tenor, which is the maturity length being read. Treasury's official daily par yield table sits on a daily rates page with a selectable series labeled Daily Treasury Par Yield Curve Rates. With that series selected, the table lists observation dates and tenor columns, including a column labeled 5 Yr. Choose the observation date, read across to that column, and write down the value with its date, its tenor and the series label.
Then confirm that the selected series matches Daily Treasury Par Yield Curve Rates, and keep the date and tenor beside the number. That way the figure stays attached to the series it came from, and a second reader can repeat the lookup and land on the same value.
Next, label the second number. For a screen quote, write the security it describes and the time it was shown. For a deposit rate, write APY only if the offer says so. If it gives only a stated rate, label it a stated rate and keep it away from the benchmark until the compounding is known. With three labeled figures, a reader can say which is the benchmark, which is a quote for a specific note, and which is a differently defined deposit rate. None of the three is an actual return.
A bounded next step is to practice once with a past date and the five-year tenor, using invented comparison values for the other two figures. The exercise is unsuitable for choosing between a Treasury and a CD, because a benchmark lookup says nothing about prices, fees, tax treatment or account terms.
The objection, the failure case and what stays open
A practical objection is that the screen quote is what a buyer would actually see, so the table seems beside the point. That is fair for someone looking at one note. Treasury says a CMT rate may not match a specific security. Before setting the two side by side, a reader should compare the time and date label on each. The table gives a consistent benchmark for a stated date. The quote speaks for one note.
The benchmark-first approach also fails in the plainest case. If a reader needs the yield on one particular note, the CMT rate is the wrong tool, since Treasury says it may not match that security. Using it anyway swaps a convenient number for the relevant one.
On who gains, who pays and over what period, the answer is limited. Yield definitions describe measurement and not a policy that moves money, so no household gains or pays anything from the definitions alone. The risk of confusion falls on a reader who assumes 4.04% promises a better outcome than 4.00%. In the hypothetical conversion, both express the same semiannual interest under different conventions. A real deposit and a Treasury holding have their own terms. No cost is established. Left open are the observed values on any date, how a specific quote relates to the table at the same moment, and the terms of any CD.